
Module 3: Data for Health Justice
Daniel Akinola-Odusola
Centric Lab
Featuring:

In this lesson, Daniel from the Centric Lab team will use two key reports from Centric Lab's air pollution work to demonstrate case studies applying air pollution data alongside other data sets to advocate for wider, political health justice advocacy.
Key Learnings: Definitions
-
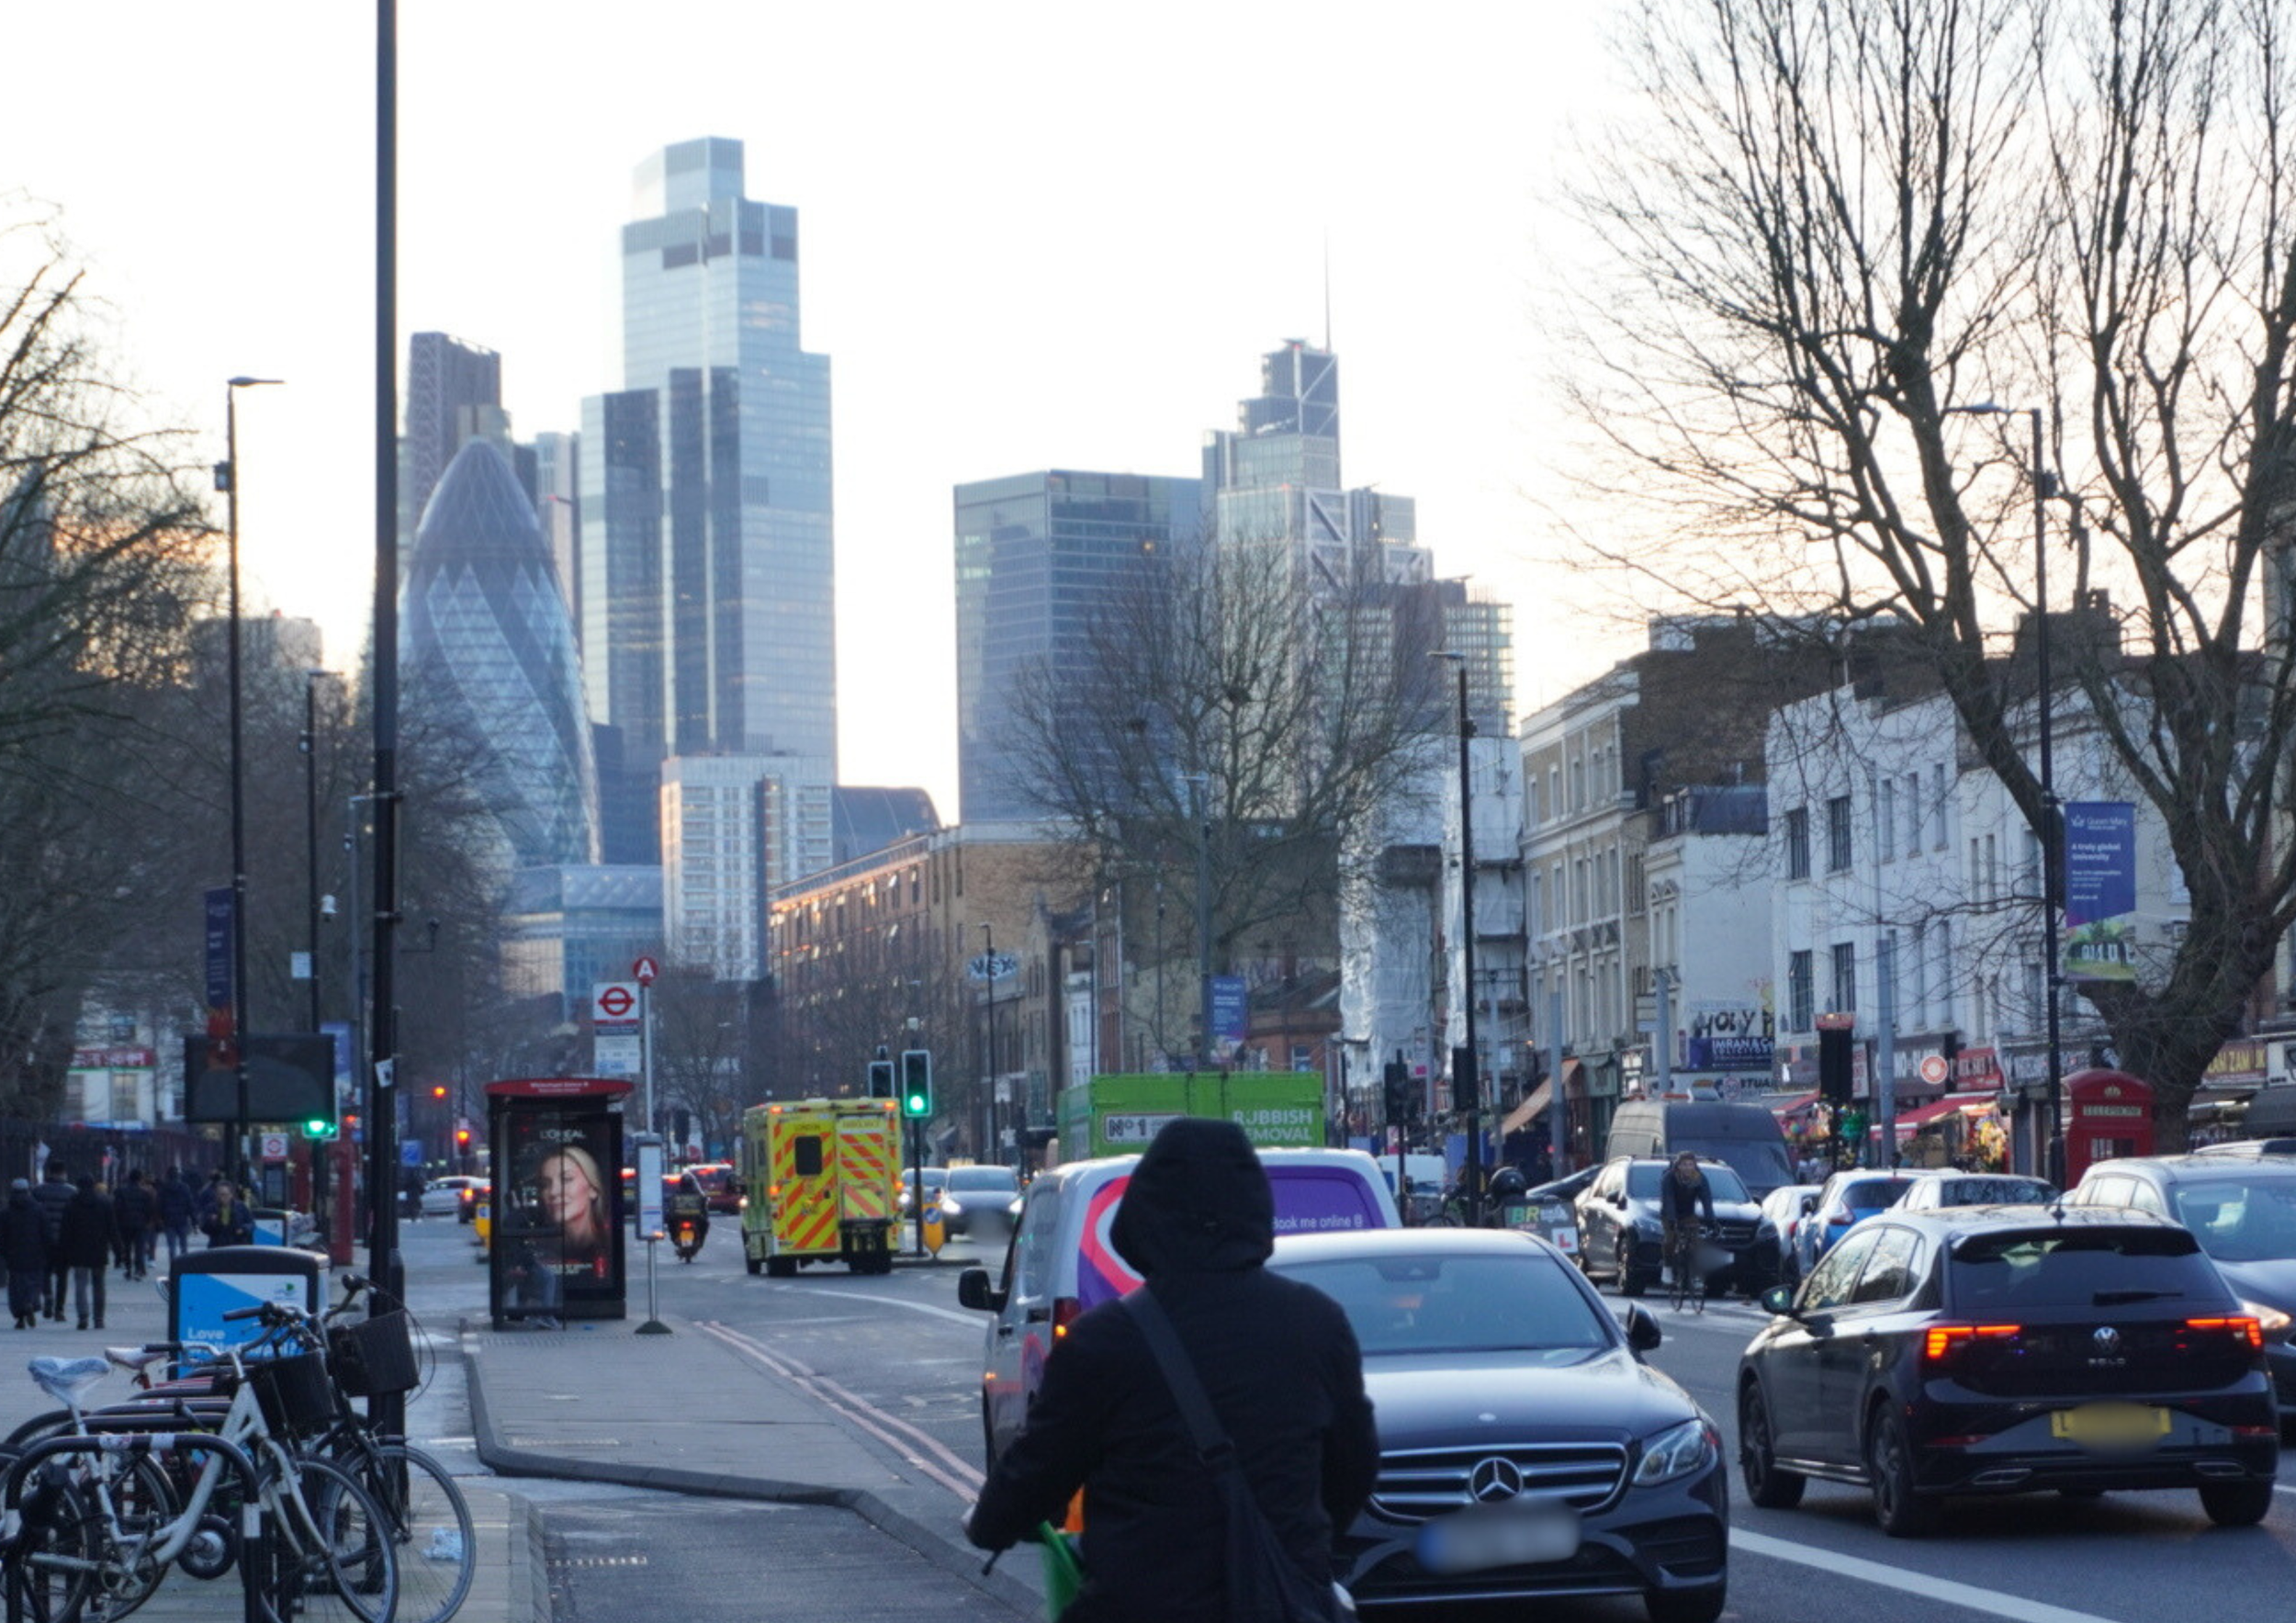
In the 1990s, the Government introduced its ‘Red Routes’ policy to designate ’clearways’ in the capital on which through traffic movements would gain greater priority over local journeys. The Red Routes cut across the capital and carry up to a third of traffic on a typical day.
-
The legal rights given to industrial polluters to contaminate our Soil, Water, and Air.
-
The working definition of a Sacrifice Zone is a geographic area that has been permanently impaired by environmental damage or economic disinvestment. However, such an expanse and non-specific definition causes two problems. Firstly, it allows for legal disputes over what is meant by “impaired” and “permanently”. These disputes often exist between what a legal firm instructed by a corporation defines as impaired or permanent and how a community abolishing injustice defines these terms based on their everyday lived experience.
Key Learnings: Our Thoughts
The purpose of this data led study is to bring attention to everyday people those who have the right to pollute in their neighbourhoods, so that people can make more informed decisions when it comes to voting and priorities for our shared health and climate change action points.
We used the urban sacrifice zone data to engage people about the intentions and structures affecting their health in their environment.
This right to pollute work does not focus on causality, it takes the assumptions that pollution and deprivation both leave communities vulnerable to tie into to other ways susceptibility is enacted that may be more relatable.
This red route hot spot analysis that looks at the intersections of data such as deprivation, population density, pollution, transport accessibility and ethnicity leaves opportunity for more lived experience data to be acknowledged in the understandings and the decisions made about place when we discuss pollution.
Experimenting with different data sets at a macro level can support education and awareness to strategy at levels you wouldn’t intuit as individuals.
What in this lesson stood out for you?
Debate Questions
These questions are framed to help you apply your own experience and perspectives to points raised in this lesson.
What is one somewhat local institution that you believe has been given a right to pollute you would challenge?
Has part of your health or livelihood been affected by red routes or similar types of arterial roads?
After hearing about these two reports, are you curious to develop your own investigations?

How To…
Apply a hot spot analysis of air pollution and infrastructure data
Use these two cases studies to further identify what other types of data and infrastructure can support your advocacy goals:
Right to Pollute 2025
This report has visualisations and tables on deprivation and pollutants covering to England, Scotland, and Wales. The observations at the end of this report can be used to shape your approach to future advocacy with data.
Rethinking London’s Red Routes: From red to green
This report is London specific but regardless of if you re London based, it can give you insight into how to apply hotspot analysis from different data about demographics, infrastructure, and activity in your community.